← 〈租界R〉トップページ
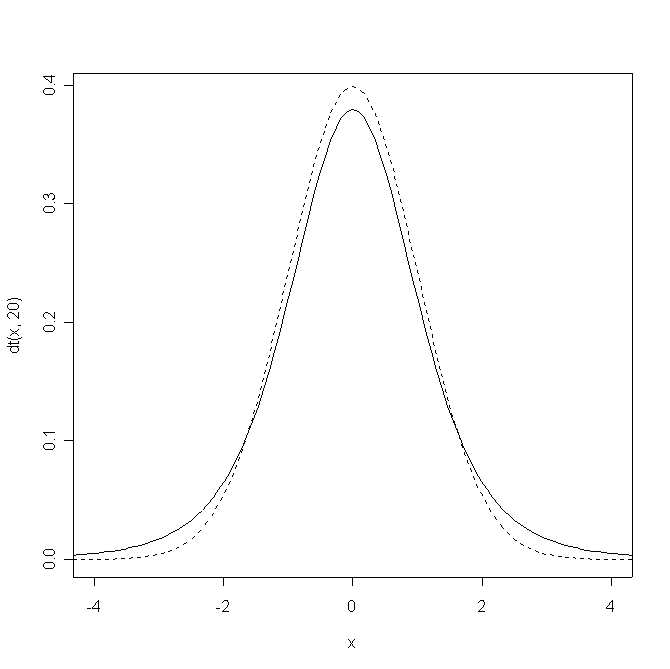
●t分布の密度関数(dt)を表示し,標準正規分布と比較
> x <- seq(-4, 4, 0.01)
> plot(x, dt(x, 20), type="n")
> curve(dt(x, 5), type="l", add=T)
> curve(dnorm(x), type="l", lty=2, add=T)
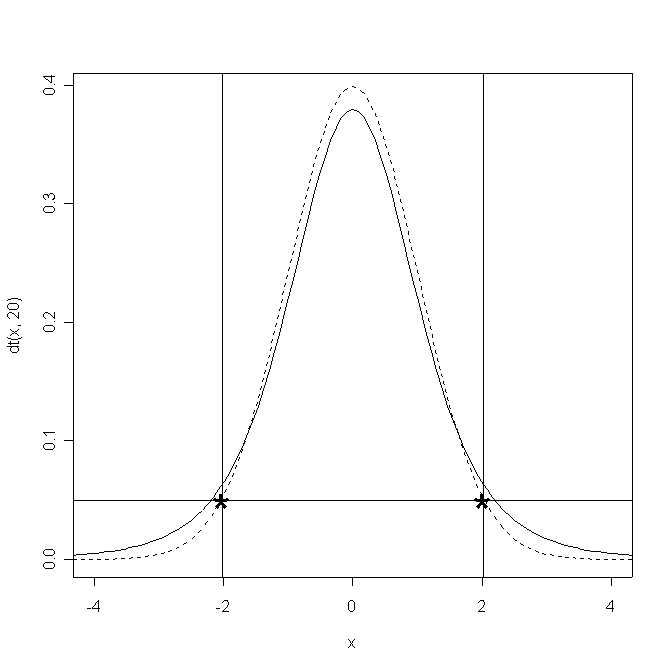
●5%点の表示
> abline(h=0.05)
> lower.alpha5 <- qt(0.05, 5)
> lower.alpha5
[1] -2.015048
> abline(v=lower.alpha5)
> points(lower.alpha5, 0.05, cex=3.0, pch="*")
> upper.alpha5 <- -lower.alpha5
> upper.alpha5
[1] 2.015048
> abline(v=upper.alpha5)
> points(upper.alpha5, 0.05, cex=3.0, pch="*")
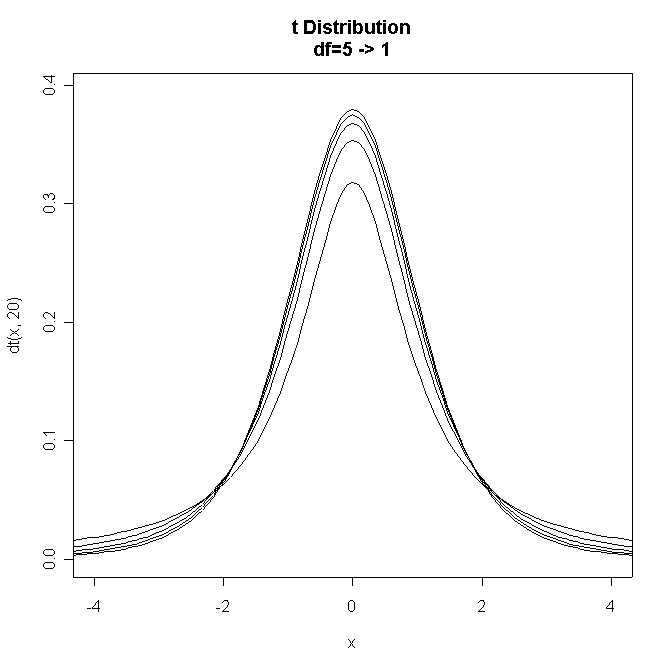
●t分布のパラメーター――自由度を変える
> x <- seq(-4, 4, 0.01)
> plot(x, dt(x, 20), type="n")
> title("t Distribution\ndf=5 -> 1")
> for (i in 1:5) curve(dt(x, 5-(i-1)), type="l", add=T)
t分布に関連する関数(dt, pt, qt, rt)
三中信宏
Copyright (c) 2004 by MINAKA Nobuhiro. All rights reserved.
●t分布の密度関数(dt)を表示し,標準正規分布と比較
> x <- seq(-4, 4, 0.01)
> plot(x, dt(x, 20), type="n")
> curve(dt(x, 5), type="l", add=T)
> curve(dnorm(x), type="l", lty=2, add=T)
●5%点の表示
> abline(h=0.05)
> lower.alpha5 <- qt(0.05, 5)
> lower.alpha5
[1] -2.015048
> abline(v=lower.alpha5)
> points(lower.alpha5, 0.05, cex=3.0, pch="*")
> upper.alpha5 <- -lower.alpha5
> upper.alpha5
[1] 2.015048
> abline(v=upper.alpha5)
> points(upper.alpha5, 0.05, cex=3.0, pch="*")
●t分布のパラメーター――自由度を変える
> x <- seq(-4, 4, 0.01)
> plot(x, dt(x, 20), type="n")
> title("t Distribution\ndf=5 -> 1")
> for (i in 1:5) curve(dt(x, 5-(i-1)), type="l", add=T)
Last Modified: 8 December 2004 by MINAKA Nobuhiro