← 〈租界R〉トップページ
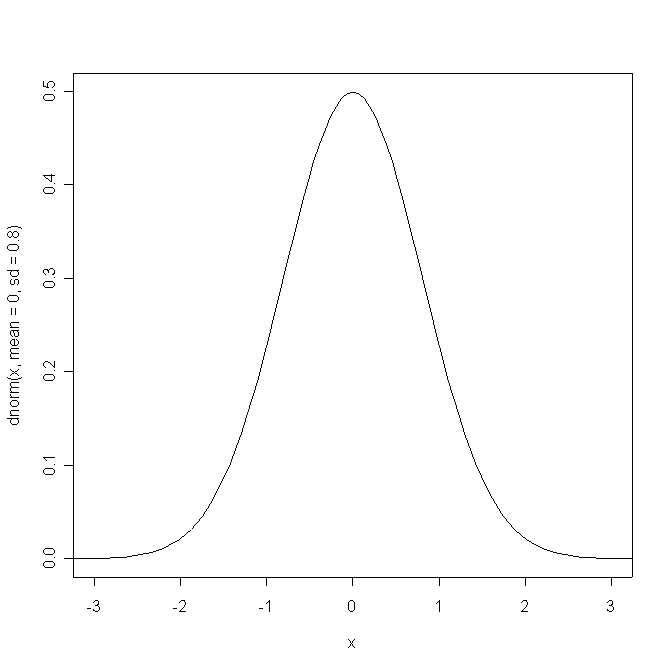
●正規分布(平均0, 標準偏差0.8)の図示
> x <- seq(-3,3,0.01)
> plot(x,dnorm(x,mean=0,sd=0.8),type="n")
> curve(dnorm(x,mean=0,sd=0.8),type="l",add=T)
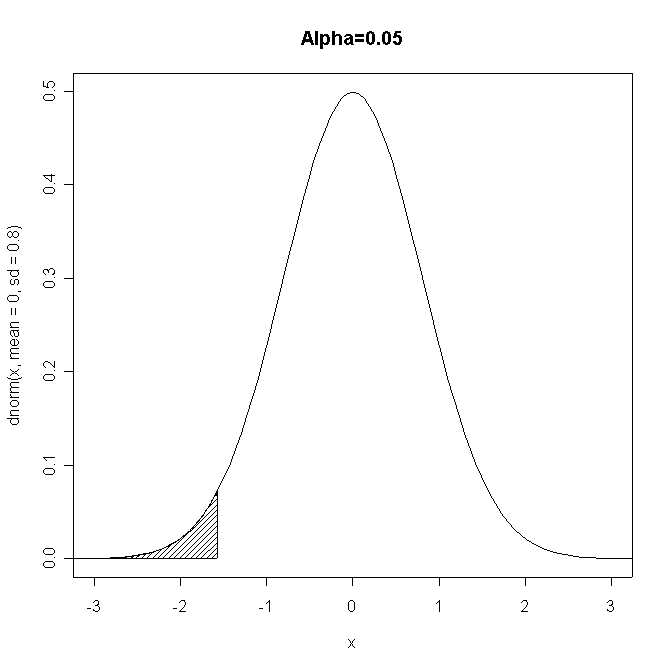
●棄却水準(α=0.05)を設定と表示
> alpha <- 0.05
> title("Alpha=0.05")
●左側棄却域の表示
> xmin <- -3
> xmax <- 3
> critical.left <- qnorm(alpha/2, mean=0, sd=0.8)
> xaxis <- seq(xmin, critical.left, length=100)
> yaxis <- c(dnorm(xaxis, mean=0, sd=0.8), 0, 0)
> yaxis <- c(dnorm(xaxis, mean=0, sd=0.8), 0, 0)
> xaxis <- c(xaxis, critical.left, xmin)
> polygon(xaxis, yaxis, density=25)
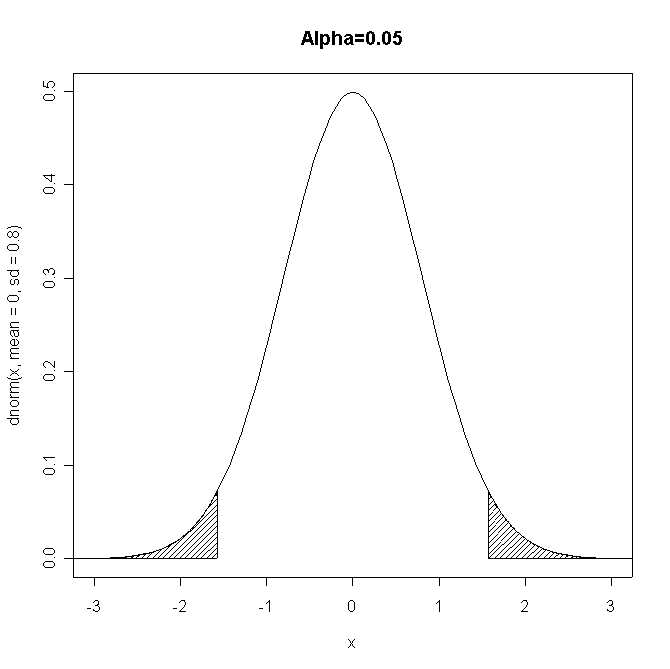
●右側棄却域の表示
> critical.right <- qnorm(alpha/2, mean=0,sd=0.8,lower.tail=F)
> xaxis <- seq(critical.right, xmax, length=100)
> yaxis <- c(dnorm(xaxis, mean=0, sd=0.8), 0, 0)
> xaxis <- c(xaxis, xmax, critical.right)
> polygon(xaxis, yaxis, density=25)
●棄却域タイトル表示
> ypos <- dnorm(critical.left, mean=0, sd=0.8)
> text(xmin, ypos, "rejection\nregion", adj=0)
> text(xmax, ypos, "rejection\nregion", adj=1)
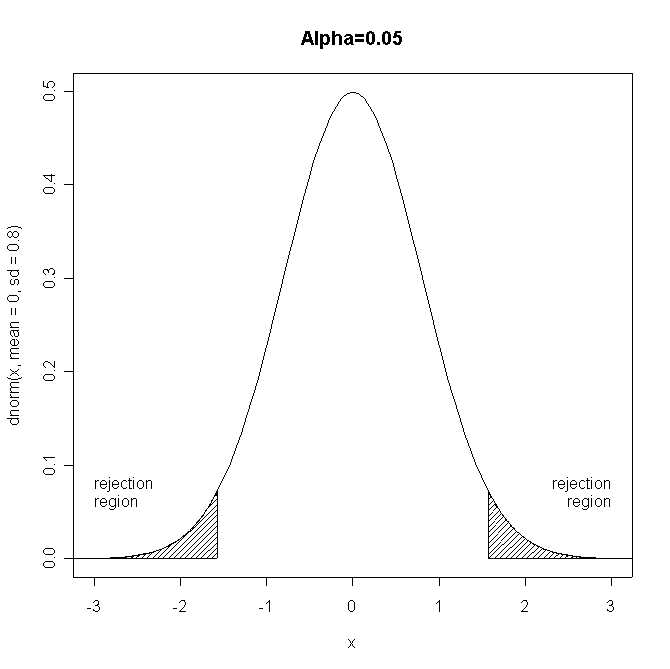
●受容域タイトル表示
> text((critical.left+critical.right)/2, 2*ypos+0.02, "acceptance region")
> xaxis <- c(rep(critical.left,2), rep(critical.right,2))
> yaxis <- c(2*ypos-0.02, 2*ypos, 2*ypos, 2*ypos-0.02)
> lines(xaxis,yaxis)
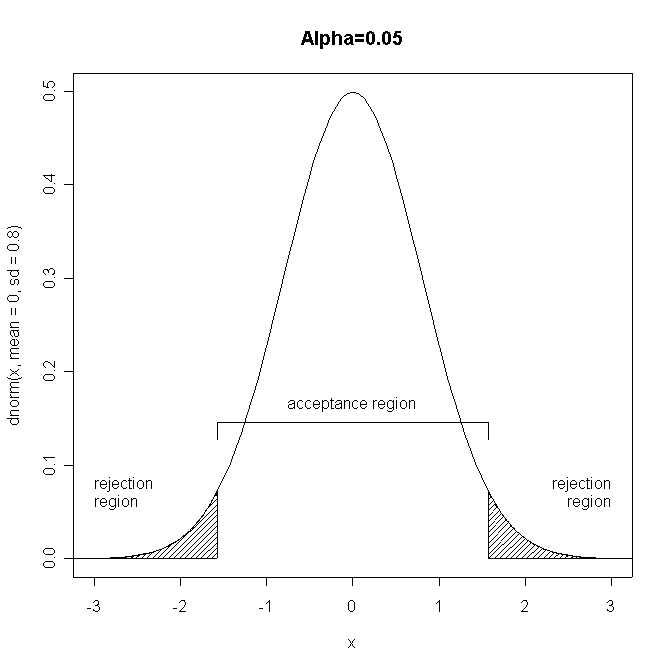
●α=0.05での棄却水準値
> critical.left
[1] -1.567971
> critical.right
[1] 1.567971
正規分布のもとでの棄却域の図示
三中信宏
Copyright (c) 2004 by MINAKA Nobuhiro. All rights reserved.
●正規分布(平均0, 標準偏差0.8)の図示
> x <- seq(-3,3,0.01)
> plot(x,dnorm(x,mean=0,sd=0.8),type="n")
> curve(dnorm(x,mean=0,sd=0.8),type="l",add=T)
●棄却水準(α=0.05)を設定と表示
> alpha <- 0.05
> title("Alpha=0.05")
●左側棄却域の表示
> xmin <- -3
> xmax <- 3
> critical.left <- qnorm(alpha/2, mean=0, sd=0.8)
> xaxis <- seq(xmin, critical.left, length=100)
> yaxis <- c(dnorm(xaxis, mean=0, sd=0.8), 0, 0)
> yaxis <- c(dnorm(xaxis, mean=0, sd=0.8), 0, 0)
> xaxis <- c(xaxis, critical.left, xmin)
> polygon(xaxis, yaxis, density=25)
●右側棄却域の表示
> critical.right <- qnorm(alpha/2, mean=0,sd=0.8,lower.tail=F)
> xaxis <- seq(critical.right, xmax, length=100)
> yaxis <- c(dnorm(xaxis, mean=0, sd=0.8), 0, 0)
> xaxis <- c(xaxis, xmax, critical.right)
> polygon(xaxis, yaxis, density=25)
●棄却域タイトル表示
> ypos <- dnorm(critical.left, mean=0, sd=0.8)
> text(xmin, ypos, "rejection\nregion", adj=0)
> text(xmax, ypos, "rejection\nregion", adj=1)
●受容域タイトル表示
> text((critical.left+critical.right)/2, 2*ypos+0.02, "acceptance region")
> xaxis <- c(rep(critical.left,2), rep(critical.right,2))
> yaxis <- c(2*ypos-0.02, 2*ypos, 2*ypos, 2*ypos-0.02)
> lines(xaxis,yaxis)
●α=0.05での棄却水準値
> critical.left
[1] -1.567971
> critical.right
[1] 1.567971
Last Modified: 8 December 2004 by MINAKA Nobuhiro