ライブラリー「cluster」に入っている〈agnes〉は,〈hclust〉と比較して,主として次の点で異なっている.
1)〈agnes〉は「weighted」オプションにより「WPGMA」を実行できる.
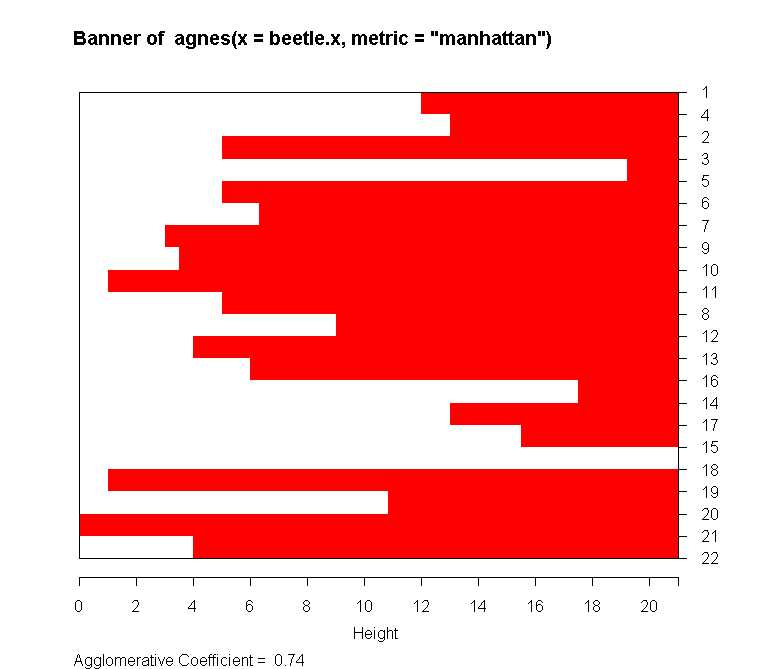
2)デンドログラムだけではなく,バナー表示が可能である.
●ライブラリー「cluster」のオープン
> library(cluster)
●データの読みこみ→データ
> beetle <- read.table("R-cluster.data", header=F)
# 「R-cluster.data」をオブジェクト「beetle」に格納する.
> beetle.x <- beetle[, -1]
# 「beetle」の第1列を除く残りを「beetle.x」に格納する.
●非類似度の計算とクラスタリング
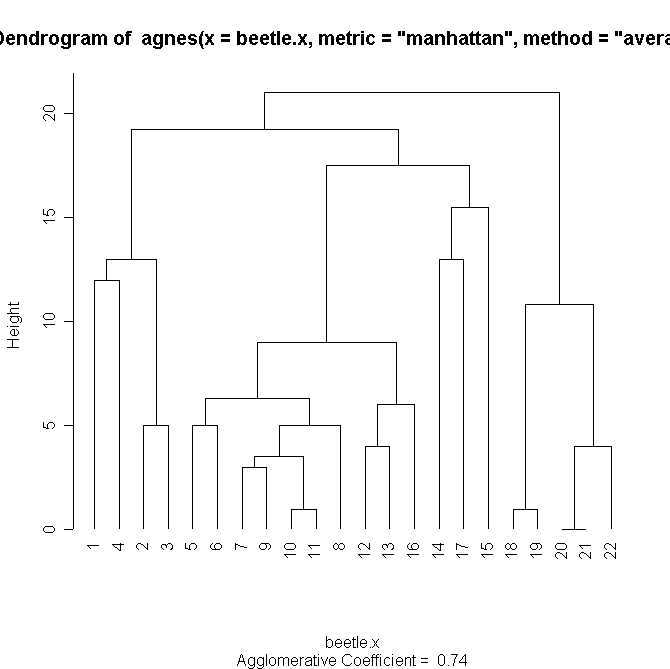
> agn <- agnes(beetle.x, metric = "manhattan", method="average")
# マンハッタン距離に基づくUPGMAクラスタリングを実行し,結果を「agn」に格納する.
> agn
# 「agn」の内容.
Call: agnes(x = beetle.x, metric = "manhattan", method="average")
Agglomerative coefficient: 0.7436501
Order of objects:
[1] 1 4 2 3 5 6 7 9 10 11 8 12 13 16 14 17 15 18 19 20 21 22
Height (summary):
Min. 1st Qu. Median Mean 3rd Qu. Max.
0.000 4.000 6.000 8.327 13.000 21.010
Available components:
[1] "order" "height" "ac" "merge" "diss" "call"
[7] "method" "order.lab" "data"
●結果の図示
> plot.agnes(agn, which.plots=1)
「バナー」によってクラスター構造を表示する.
> plot.agnes(agn, which.plots=2, hang=-1)
「デンドログラム」によってクラスター構造を表示する.